JSpecView as a JCAMP-DX Data Viewer for Windows
History
Authors: D.A.P. Facey, K.A. Bryan and R.J. Lancashire,
Department of Chemistry, UWI, Mona Campus, Kingston JAMAICA, JMAAW15
(robert.lancashire@uwimona.edu.jm)
C. Muir and H. Reichgelt, originally from the Department of Computer Science
and Mathematics, UWI, Mona, Kgn7 JAMAICA
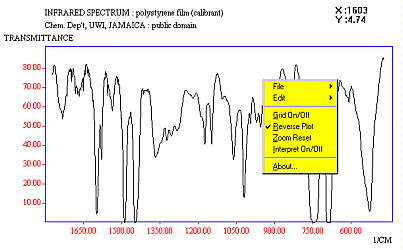
In 1988, the Department purchased a diskless Perkin Elmer 1605
FTIR. To help in the process of being able to store the IR
spectra recorded, two Pascal programs were written. The first to capture
the files via the serial port (RS-232) and the second to display
the data.
For information on the first program, FTtoPC, and other DOS
utilities to convert files obtained from various instruments to
JCAMP-DX format, see our JCAMP-DX utility
page.
The original display program was totally rewritten in C++
and the code licensed to MDL in 1998 for incorporation into their plugin
CHIME. Our contract with MDL has now finished (November 2005) but we
will endeavour to be involved with future upgrades to the CHIME plugin.
The last release (2.6 SP6) was April 2004 and this is available from
the MDL web site..
In March 2006 we released JSpecView as an Open Source project at
Sourceforge. A report on this
is published in
Chemistry Central Journal 2007, 1:31 (07Dec2007).
The JAVA applet and application along with source code is being developed with
JAVA 1.5+.
In some of the demonstrations and
examples we show the use of links between spectra and
molecular graphics display such that clicking on peaks in a Mass
Spectrum will highlight the relevant FRAGMENTS in the molecule,
clicking on peaks in the IR spectrum will highlight the relevant
BONDS or animate the vibrational mode and clicking on peaks in
the NMR will highlight the appropriate protons or carbon atoms.
See below for more details on how to
set up these links.
Justification
With the widespread use of the WWW growing so unbelievably fast,
the idea of being able to link not only molecular coordinates via
MOL (PDB) format to a document, but being able to display various
types of spectra seemed a wonderful opportunity to enhance the
teaching of spectroscopy. To that end, problem sets can be
established of known and unknown samples to view. See a makeup demo of how
this might look. The possibility of sub-structure searches
returning structures and spectra can now be accomplished.
Information needed to configure a server for use with MDL CHIME
The MIME types posted by our web server for "chemical" type files are:
| mime type |
file extension |
| chemical/x-mdl-molfile |
mol |
| chemical/x-mdl-rxnfile |
rxn |
| chemical/x-pdb |
pdb emb embl |
| chemical/x-xyz |
xyz |
| chemical/x-gaussian-input |
gau |
| chemical/x-mopac-input |
mop |
| application/x-spt |
spt |
| chemical/x-csm |
csm csml |
| chemical/x-jcamp-dx |
jdx dx |
| application/x-rasmol |
scr |
| chemical/x-mdl-tgf |
tgf skc |
| chemical/x-gaussian-cube |
cub cube |
To configure the CHIME plugin, all you need to do is run the
installer. To test, try out the demo files or sample testdata
files.
For the JAVA application, JSVApp.jar, there are several files
that need to be available in the same directory as the
jar file. See the README.txt file in the file release for
details.
The JCAMP-DX data exchange formats and standards are currently
the responsibility of the IUPAC Committee on Printed and
Electronic Publications (CPEP). The CPEP JCAMP working party is
chaired by Antony Davies, ISAS, Germany.
Joint Committee on Atomic and Molecular Physical Data
Exchange References.
A copy of some of the following papers is available in Adobe
Acrobat (PDF) format from the JCAMP-DX web site (www.jcamp-dx.org).
- JCAMP-CS vs 3.7 Ref.: Applied Spectroscopy, 1991, 45, 4.
- JCAMP-DX vs 4.24 for IR Ref.: Pure & Applied Chemistry, 1991,
63, 1781-92.
- for NMR vs 5.0 Ref.: Applied Spectroscopy, 1993, 47,
1093-1099.
- for MS vs 5.0 Ref. : Applied Spectroscopy, 1994, 48,
1545-1552.
- extension 5.01 for NMR, Ref.:
Pure & Applied Chemistry, Vol. 71, No. 8, pp. 1549-1556, 1999.
- for IMS vs 5.01 Ref.:
Pure & Applied Chemistry, Vol 73, No. 11, pp 1765-1782, 2001
- for NMR pulse sequences Ref.:
Pure & Applied Chemistry, Vol 73, No. 11, pp 1749-1764, 2001
- for EMR vs 5.01 Ref.:
Pure & Applied Chemistry,78(03), 613-631, 2006
- JCAMP-DX vs 5.01 with CD Ref.:
Pure & Applied Chemistry, Vol 84, No. 10, pp. 2171�2182, 2012.
For an historical account of JCAMP-DX development, see the
summary posted on the bionet.structure-nmr news group in January
1996. A local copy has been made
available by the author.
The pages on JCAMP-DX by Antony Davies and Bob
McDonald are essential reading for anyone interested in
learning more about the JCAMP-DX specifications.
(Tony chairs the IUPAC working group on JCAMP-DX and Bob, who was
a member, coauthored the original paper describing
JCAMP-DX for IR). Both have provided test data for downloading
from their web sites.
The method of encoding data, relies on substitution of numbers
by ASCII characters. The following gives the compression tables
used for this purpose.
| Compression Table |
| ASCII digits |
0 |
1 |
2 |
3 |
4 |
5 |
6 |
7 |
8 |
9 |
| Positive SQZ digits |
@ |
A |
B |
C |
D |
E |
F |
G |
H |
I |
| Negative SQZ digits |
� |
a |
b |
c |
d |
e |
f |
g |
h |
i |
| Positive DIF digits |
% |
J |
K |
L |
M |
N |
O |
P |
Q |
R |
| Negative DIF digits |
� |
j |
k |
l |
m |
n |
o |
p |
q |
r |
| Positive DUP digits |
� |
S |
T |
U |
V |
W |
X |
Y |
Z |
s |
|
|
| Compression types handled by
CHIME/JSpecView |
| FIX |
e.g. 99 98 97 96 98 93 |
fixed format |
| PAC |
e.g. 99+98+97+96+98+93 |
packed |
| SQZ |
e.g. 99I8I7I6I8I3 |
simple compression |
| DIF |
e.g 99jjjKn |
difference |
| DUP |
e.g 99jUKn |
difference and duplicates |
| CSV |
e.g 99,98,97,96,98,93 |
Comma separated values |
|
Creating links between spectra and 3D molecular graphics
display
The original mechanism used for CHIME in creating the links was to add new HEADER
items to the JCAMP-DX file (##$ASSIGNMENT TYPE= , ##$CHIME
TARGET= along with ##$PEAK LINKS= ).
With the release of MDL Chime 2.6SP5 there was no need to edit the JCAMP-DX file
and all the links could be controlled via JavaScript code.
See a report on "Embedding spectra and structures in your web pages",
in
Spectroscopy Europe 17(5), 28-30, 2005.
The JavaScript code can be handled as external files and by using an HTML template
it is only necessary to change the name of the file containing the data.
This can be easily done with a text editor without knowledge of HTML.
The method below shows what was used for the JAVA version of JSpecView
A sample set of JavaScript files are given below. The first establishes
the arrays that will hold the link information and includes the setup for
IR and both H and C NMR while the second contains
the actual FTIR spectral information that is used to link the spectra to the
molecular display animations of the vibration modes.
Contents of setup.js
//edit the following lines with caution!

var IRinfo = new Array();
function IRLinks(x,y,w,script,desc) {
  var n=IRinfo.length;
	IRinfo[n] = new Array();
	IRinfo[n].xpos=x;
	IRinfo[n].ypos=y;
	IRinfo[n].width=w;
	IRinfo[n].script=script;
	IRinfo[n].desc=desc;
}

var HNMRinfo=new Array()
function HNMRLinks(x,y,w,script){
 var n=HNMRinfo.length;
 HNMRinfo[n]=new Array();
 HNMRinfo[n].xpos=x;
 HNMRinfo[n].ypos=y;
 HNMRinfo[n].width=w;
 HNMRinfo[n].script=script;
}

var CNMRinfo=new Array();
function CNMRLinks(x,y,w,script){
 var n=CNMRinfo.length;
 CNMRinfo[n]=new Array();
 CNMRinfo[n].xpos=x;
 CNMRinfo[n].ypos=y;
 CNMRinfo[n].width=w;
 CNMRinfo[n].script=script;
}

//you should not need to edit the html files.
Contents of acetoph.js
//edit the following lines with the spectral information

var IRfilName= "acetophenone.jdx";
var MolfilName= "acetophenone.xyz";

IRLinks(3101, 1, 20, 1,"symm stretch of aromatic CH group (~3100 cm-1)");
IRLinks(3086, 1, 15, 2,"asymm stretch of aromatic CH group (~3085 cm-1)");
IRLinks(3062, 1, 15, 3,"asymm stretch of CH group (~3060 cm-1)");
IRLinks(3038, 1, 10, 4,"asymm stretch of CH group (~3040 cm-1)");
IRLinks(3029, 1, 10, 5,"asymm bend of CH3 group (~3030 cm-1)");
IRLinks(3005, 1, 20, 6,"symm stretch of methyl group (~3005 cm-1)");
IRLinks(2969, 1, 30, 7,"asymm stretch of methyl group (~2970 cm-1)");
IRLinks(2921, 1, 30, 8,"symm stretch of CH group (~2920 cm-1)");
IRLinks(1684, 1, 30, 9,"Carbonyl stretching band (~1685 cm-1)");
IRLinks(1599, 1, 30, 12,"C-C of aromatic group (~1600 cm-1)");
IRLinks(1449, 1, 20, 14,"symm stretch of CH3 group (~1450 cm-1)");
IRLinks(1359, 1, 30, 16,"C-H twist of methyl group (~1360 cm-1)");
IRLinks(1265, 1, 20, 21,"scissors of aromatic C-H groups (~1265 cm-1)");
IRLinks(1180, 1, 40, 22,"scissors of CH group (~1180 cm-1)");
IRLinks(1078, 1, 30, 25,"symm stretch of CH3 group (~1080 cm-1)");
IRLinks(1025, 1, 20, 26,"symm stretch of CH group (~1025 cm-1)");
IRLinks(1001, 1, 20, 27,"asymm bend of CH3 group (~1000 cm-1)");
IRLinks(956, 1, 20, 28,"aromatic ring perturbation mode (~955 cm-1)");
IRLinks(760, 1, 20, 31,"aromatic ring perturbation mode (~760 cm-1)");
IRLinks(691, 1, 20, 33,"aromatic ring perturbation mode (~690 cm-1)");
IRLinks(588, 1, 20, 37,"concerted rocking mode of CH groups (~590 cm-1)");

var ShowDesc= "T";

var title= "acetophenone";
var author= "Prof. Robert John Lancashire";
var address1= "Department of Chemistry";
var address2= "University of the West Indies";
var address3= "Mona, Kingston 7, JAMAICA";
var lastMod= "8th March 2006";

//you should not need to edit the html files.
JSpecView (2006) and merged with Jmol 2012
The HTML file (acetophenone.html)
that calls these files gives an example of linking spectra to molecular display and loads a single Block file
of spectra and includes MOL files and animation file (xyz) containing the vibration vectors. When peaks in the IR
are selected in the JSpecView spectral display the appropriate FRAME in the xyz file is displayed.
For the NMR displays the peaks are linked to the atom (H or C) that are responsible for the peak seen.
For the MS display the highlighted peaks are linked to the fragment responsible
Jmol is another Open Source project originally available from Sourceforge.
The JSpecView and Jmol applets were merged in early 2012 after collaboration with Prof Bob Hanson at St Olaf College.
Bob has made numerous enhancements to the code and taken on the future development since my retirement.
JSmol - from 2013
The open source HTML5/JavaScript package of JSmol incorporating JSpecView and Jmol was first released in October 2013.
JSmol is a JavaScript framework that allows web developers to create pages that
utilize either Java or HTML5 (no Java), at will. This enables Jmol to display
interactive 3D molecular structures on devices that do not have Java installed,
or for which Java is not available (such as smart phones and some tablet computers,
e.g. iPad) or has not been installed because of concerns for Java being a security threat.
Since the latest Javascript code is generated from the Java via a transpiler, the JAR files are available still and
can be downloaded for off-line display and processing (JSpecView is ~1 MB
and Jmol is ~11 MB).
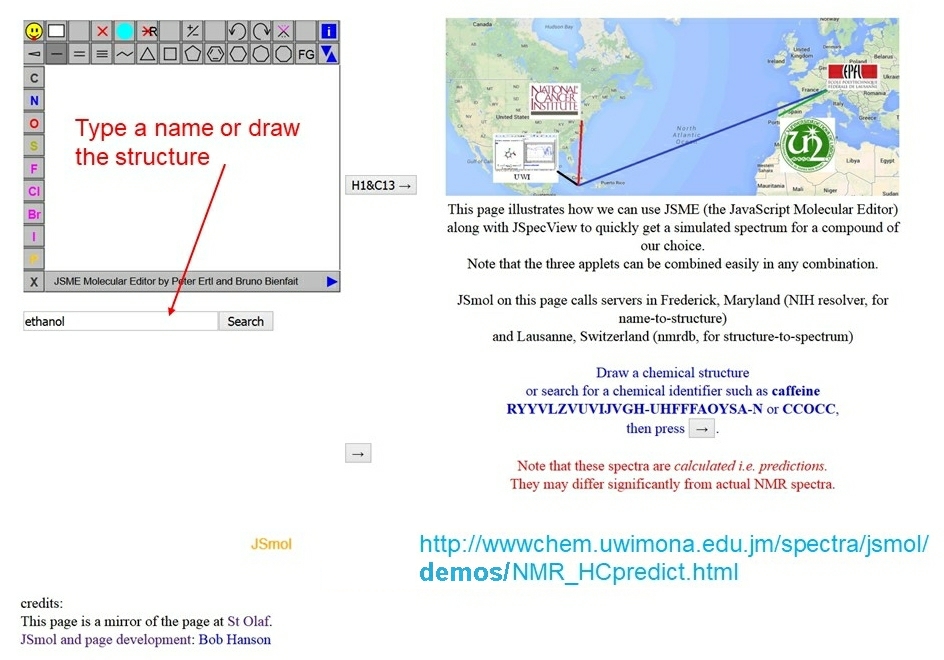
JSmol is integrated fully with JSME as well and an example that uses all 3 involves the
use of the JSmol on a
webpage
that calls servers in Frederick, Maryland (NIH resolver, for name-to-structure)
and Lausanne, Switzerland (nmrdb, for structure-to-spectrum). By drawing a structure in JSME
or by simply providing a name of a molecule and submitting the information then within
about 10 seconds simulated NMR spectra (H and/or C) are displayed
and this allows for changes to the structure to be made and resubmitting so
that the spectra can be compared. The H or C atoms in the 2D and 3D molecular structures
displayed are linked to the peaks in the spectra. Clicking on an atom or on a peak will
highlight both in the displays.
More details are in
Spectroscopy Europe 26(5) 15-17, 2014
Sample test files for error checking
A collection of
files useful for checking JCAMP-DX programs have been
assembled from various sources. Some provide error free
information, while others are more of the nature of an "assault
course for JCAMP-DX".
Some
FAQ on scientific data formats (including JCAMP-DX) have been
collated by Ilana Stern and posted at a number of sites.
There are several other data formats commonly found in
scientific laboratories such as NUTS for NMR and netCDF for MS
and chromatography.
A company that for many years specialised in offering not
only interfaces to equipment, but converters between data formats
was Galactic Industries Corporation now Thermo Fisher Scientific.
Their product, GRAMS, uses .SPC binary files and a number
of sites offer spectra in this format. Thermo offer a
SPC Developers Kit for programmers to create their own file converters etc.
Try their searchable database of IR and
Raman spectra.
The following links may be useful for more details of databases
and viewers:
KnowItAll
 from Bio-Rad, originally
marketed as ChemWindows and the Sadler Suite, can read and display a wide
range of spectral file types, including JCAMP-DX. A handy feature is that it
allows you to insert live IR, NMR, MS spectra, and chromatograms into Microsoft
applications like Word and Powerpoint.
from Bio-Rad, originally
marketed as ChemWindows and the Sadler Suite, can read and display a wide
range of spectral file types, including JCAMP-DX. A handy feature is that it
allows you to insert live IR, NMR, MS spectra, and chromatograms into Microsoft
applications like Word and Powerpoint.
Another commercial company that has made a large impact on data
visualisation and handling is ACD Labs.
ACD/Spectral Processing Software
allows the user to process a range of spectral types: NMR, MS, UV,
Visible, IR, NIR and Raman spectra.
Supported file formats include the following: ACD (*.esp), Galactic
(*.spc), JCAMP-DX (*.jdx, *.dx. *.jxs,*.jx) and ASCII (*.txt).
 Return to Chemistry, UWI-Mona, Home
Page
Return to Chemistry, UWI-Mona, Home
Page
Copyright © 1994-2021 by Robert John Lancashire,
all rights reserved.
Created and maintained by Prof. Robert J.
Lancashire,
The Department of Chemistry, University of the West Indies,
Mona Campus, Kingston 7, Jamaica.
Created Oct 1994. Links checked and/or last
modified 15th November 2021.
URL
http://wwwchem.uwimona.edu.jm/software/jcampdx.html