Help on using Tanabe-Sugano diagrams
To make use of the Tanabe-Sugano diagrams provided in
textbooks, it would be expected that they should at least be able
to cope with typical spectra for d3, d8
octahedral and d2, d7 tetrahedral systems
since these are predicted to be the most favoured from Crystal
Field Stabilisation calculations. This is not the
case. All the diagrams presented are impractical, being
far too small and for chromium(III) actually stop before the
region of interest of many simple coordination complexes.
No textbooks give Tanabe-Sugano diagrams for tetrahedral
systems. The spectra of tetrahedral complexes are generally not
considered or are treated by the use of Orgel diagrams. If we
ignore spin-forbidden transitions, where the energy of the states
depend on both the B and C Racah parameter, then it should be
possible to use the dn, d10-n relationship
between octahedral and tetrahedral for interpretation of the
spin-allowed transitions. This is because, for example, the
d3 octahedral and d7 tetrahedral states
have the same energy dependencies on Δ/B.
When using the Tanabe-Sugano diagram in this way the major
difference is that the size of Δ
tetrahedral is only roughly 4/9 times that of
Δ octahedral and so all complexes are high spin and the
area of interest is moved closer to the left hand side of the
diagram.
Procedure
- Record the UV/Vis spectrum of your sample.
- Tabulate peak information in wavelengths (nm) and convert to
wavenumbers (cm-1), {ν = 107 / λ}
- calculate the extinction coefficients based on the concentration
- calculate the experimental ratio of v2 / v1
- use the appropriate Tanabe-Sugano
diagram to locate where the ratio of the second to first peak
matches that of the experimental value above. For d2 (oct), d8
(tet) and d3, d8 (oct) d2, d7 (tet) JAVA
applets and spreadsheets are
available which perform these calculations.
- Tabulate the values of v1 / B', v2 / B', v3 / B' from the
Y-intercepts and Δ/B' from the
X-intercept.
- Using your experimental values of v1 and v2 (v3 if seen),
calculate an average value of B' from these Y intercept
values.
- Calculate Δ based on your value of
Δ/B'.
- Assign all the spin-allowed transitions you observed.
- Comment on the size of the experimental B' compared to the
free-ion value.
- Do you observe any peaks that might be spin-forbidden
transitions? If so, can you assign them?
- Comment on the size of your calculated extinction
coefficients and relate this to the relevant selection rules.
The expected values should be compared to the following rough
guide.
For M2+ complexes, expect Δ=
7500 - 12500 cm-1.
For M3+ complexes, expect Δ=
14000 - 25000 cm-1.
B for first-row transition metal free ions is around 1000
cm-1. Depending on the position of the ligand in the
nephelauxetic series, this can be reduced to as low as 60% in the
complex.
Extinction coefficients for octahedral complexes are expected to
be around 50-100 times smaller than for tetrahedral complexes.
For a typical spin-allowed but Laporte (orbitally) forbidden
transition in an octahedral complex, expect
ε < 10 m2mol-1.
Example.
For an octahedral Ni(II) complex, three peaks were observed at 8000, 13200
and 22800 cm-1. From the ratio v2/v1 of 1.65 this
gives a value of Δ/B' of 10.0.
This can be shown in the following diagram.
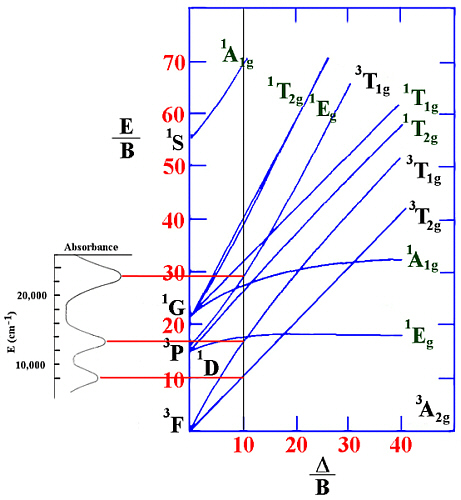
Since v1= Δ in this case (and equals 8000 cm-1) then B'
can be evaluated to be 800 cm-1.
The spin-forbidden lines that would be between v2 and v3 in energy
are not observed in the spectrum nor are any lines seen at higher energy.
A set of UV/Vis spectra (in
JCAMP-DX format) of some simple first row aqua ions are
available.
A detailed set of
examples based on Cr(III) complexes have been
described using the JAVA applets JSpecView, Jmol and TSd3applet. From the Cr(III) spectrum
displayed, the ratio of the energies of the two peaks are calculated
based on the user clicking on the peak positions. Then a JavaScript
submits this information to the TS d3 Applet and it automatically draws a
vertical line with that ratio and estimates the Racah parameter B'
and the energy of the third peak.
References
Ligand Field Theory and its Applications, B.N. Figgis and
M.A. Hitchman, Wiley-VCH, New York, 2000.
Inorganic Chemistry, J.E. Huheey, 3rd Edition, Harper & Row
Publishers, New York 1983.
Copyright © 1999-2019 by Robert John
Lancashire, all rights reserved.
Created and maintained by Prof. Robert J.
Lancashire,
The Department of Chemistry, University of the West Indies,
Mona Campus, Kingston 7, Jamaica.
Created Feb 1999. Links checked and/or last modified
2nd April 2019.
URL
http://wwwchem.uwimona.edu.jm/courses/Tanabe-Sugano/index.html