Ginger (Zingiber officinale Rosc.) is thought to have been introduced into Jamaica about 1525. By 1547 though, it is reported that the export of ginger amounted to over 22,000 quintals (1200 metric Tonnes).
Prior to 1740, the ginger was associated with the Parish of St Ann, where it had first been planted by the Spanish. After that the Christiana region took over when it was recognised that the soil and climatic conditions were especially suitable for the growing of ginger. In 1980, a survey by the International Trade Centre reported that 1,100 acres of ginger were planted in Jamaica in the central range areas of Clarendon, Manchester and Trelawny.
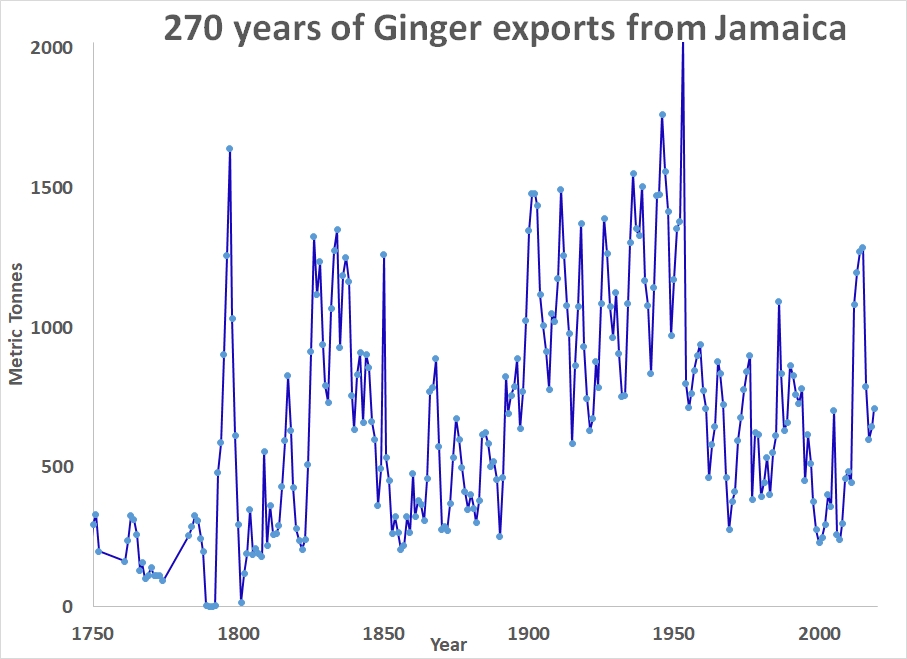
Between the 1930's and 1960's, Jamaica was listed as one of the three largest producers/exporters of ginger in the world, along with India and Sierra Leone. A 16-Kilometre radius around Christiana was identified as the region which grew the finest ginger in the world. Since then, as shown in the chart, the exports fell significantly, from close to 2,000 metric tonne of ginger in 1953 to a low of around 200 in 2006-2007 before rising again in 2015.
In July 2025, Jamaica selected ginger as its Special Agricultural Product (SAP) and is developing the ginger value chain as one of 11 countries supported by a global project of the Food and Agriculture Organization (FAO) of the United Nations.
The fall in Jamaica's ginger production/export in the early 1990s was due to the impact of the rhizome rot and bacterial wilt diseases, that effectively rendered the country as a net importer of the product.
The chief constraint for production seems to be associated with peeling, as this is time consuming and costly. An average worker can peel about 11 Kg of green ginger per day, which amounts to less than three (3) Kg of dried ginger. Another problem is that it is difficult to recruit new young staff. They are generally unwilling to take part in the peeling, which is usually left to older family members. Preparation involves removing the soil, then peeling the outer skin and spreading on mats in the sun for about 10 days in the sun, to reduce the moisture content to 10-12%
The 2019-2024 country production figures from the FAO web site include Jamaica. These are shown in the Table below:
| Top Ginger Production Figures | ||
|
(Approx. Annual 2019-2024) metric tonnes |
||
| Rank | Country | Production |
| 1 | India | 2000000 |
| 2 | Nigeria | 740000 |
| 3 | China | 640000 |
| 4 | Nepal | 305000 |
| 5 | Indonesia | 186000 |
| 6 | Thailand | 172000 |
| 7 | Cameroon | 83434 |
| 8 | Bangladesh | 80234 |
| 9 | Japan | 45506 |
| 10 | Philippines | 26929 |
| 11 | Peru | 25835 |
| 12 | Taiwan | 23986 |
| 13 | Mali | 17137 |
| 14 | Sri Lanka | 15687 |
| 15 | Ethiopia | 11741 |
| 16 | Malaysia | 11205 |
| 17 | Fiji | 9398 |
| 18 | Ivory Coast | 7083 |
| 19 | Bhutan | 6209 |
| 20 | South Korea | 5211 |
| 21 | Mexico | 3860 |
| 22 | Costa Rica | 2500 |
| 23 | Guyana | 2307 |
| 24 | Grenada | 870 |
| 25 | Jamaica | 712 |
| 26 | United States | 638 |
| 27 | Kenya | 359 |
| 28 | Mauritius | 268 |
| 29 | Dominica | 232 |
| 30 | Trinidad and Tobago | 199 |
Jamaica can be seen to have dropped to a ranking of number 25 despite its reputation for flavour.
 Biscuit wrapper from Australia
- the volatile oils, a mixture of terpenoids which imparts the
characteristic aroma and modifies the taste.
- the non-volatile pungent principles, such as the
gingerols,
shogaols,
paradols and zingerone which produce the "hot" sensation in
the mouth.
The extractives (oil and oleoresin) are obtained from the dried rhizomes. About 2-3% of ginger oil is obtained on steam distillation and the main constituents include:
| Sample Origin | 6-gingerol | 8-gingerol | 10-gingerol | 6-shogaol | Total Gingerols |
|---|---|---|---|---|---|
| Clarendon-1 | 12.25 | 2.70 | 4.34 | 1.48 | 19.29 |
| Clarendon-2 | 11.98 | 2.35 | 3.44 | 1.38 | 17.77 |
| St Thomas-1 | 16.07 | 5.02 | 4.20 | 3.21 | 25.29 |
| St Thomas-2 | 10.77 | 2.11 | 2.16 | 0.94 | 15.04 |
| St Thomas-3 | 12.72 | 2.52 | 3.78 | 1.50 | 19.02 |
| St Thomas-4 | 13.96 | 3.66 | 3.91 | 1.28 | 21.53 |
| St Ann-1 | 12.71 | 2.63 | 4.00 | 1.40 | 19.34 |
| Minimum | 10.77 | 2.11 | 2.16 | 0.94 | 15.04 |
| Maximum | 16.07 | 5.02 | 4.34 | 3.21 | 25.29 |
| Average | 12.92 | 3.00 | 3.69 | 1.60 | 19.61 |
 Return to Chemistry, UWI-Mona,
Home Page
Return to Chemistry, UWI-Mona,
Home Page
Copyright © 1995-2026 by Robert John Lancashire, all rights reserved.
Created and maintained by Prof. Robert J. Lancashire,