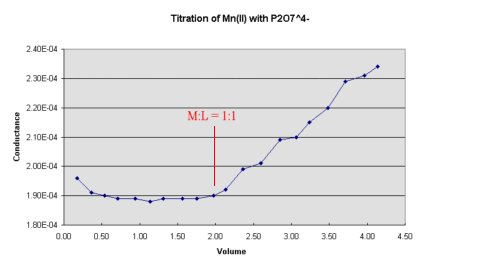
 Figure 1.
The inflection points in the curves can be used to determine the composition of the the metal pyrophosphate complexes.
The enzymes which catalyse this hydrolysis and/or phosphate transfer reactions require Mg2+, K+, Na+, Ca2+ or Mn2+ for activity. ATP itself, being highly charged, is mostly found as the Mg2+ chelate in cells. The equilibrium constants for some metal ions with ATP and pyrophosphate are recorded in the Table below.
Since about 1930, salts of polymeric phosphorus oxoanions have been used increasingly for water treatment, for water softening and as detergent builders. When used for water treatment, Ca2+ is chelated in a soluble or suspended form. This effectively reduces the free calcium concentration and prevents the precipitation of calcium carbonate. Likewise, calcium is also prevented from forming precipitates with soaps or interacting detrimentally with detergents. Many detergents are now phosphate-free however since phosphorus from waste water was recognised as a major culprit in excessive eutrophication.
Plots of conductance versus volume of titrant added will show discontinuity at the end point which may then be determined by producing the straight sections of the graph to the point of intersection. The actual values of the conductivity of the solution need not be calculated as only relative values are required and the readings from the conductance bridge may be used directly without having to correct for the cell constant.
This experiment investigates the types of chelates formed in
pyrophosphate-metal ion systems using the conductimetric
titration technique. A solution of sodium pyrophosphate is
titrated with a solution of various metal ions. A plot of
conductance versus volume of titrant added should give a graph of
the form shown below in
Figure 1.
The inflection points in the curves can be used to determine the
composition of the the metal pyrophosphate complexes.
50 cm3 of 0.1 mol dm-3 Na4P2O7.10H2O;
1)  25 cm3 of 0.1 mol dm-3 solution MgSO4;
2)  25 cm3of 0.1 mol dm-3 solution of CaCl2.6H2O;
3)  25 cm3 of 0.1 mol dm-3 solution MnSO4.H2O;
4)  25 cm3 of 0.1 mol dm-3 solution of CuSO4.5H2O.
You are required to do four titrations, one for each metal ion. In each case, withdraw 2.0 cm3 of the 0.1M Na4P2O7.10H2O solution and dilute it to 500 cm3. Transfer this solution into a 1000 cm3 beaker, insert a conductance cell and record the conductance of the solution. Record the pH. Titrate this solution with the solution of the metal ion (added using a burette) stirring continuously except for the time of reading the conductance. Record the conductance of the mixture after every 0.20 cm3 addition of the titrant. Record the pH.
Plot the conductance versus the volume of the titrant added. Note that since the total volume changes are negligible the effect of dilution may be ignored and the volume of titrant added may be used to give the concentration of the titrating species.
Use this plot to determine the composition of the chelates formed, carefully labelling the graph where the M:L ratio is 1:1.
Transfer 20 cm3 of 0.1 M Na4P2O7.10H2O solution to a 250 cm3 beaker, dilute to 100 cm3, insert a pH electrode and record the pH of the solution. Titrate with standardised 0.1 M HCl, recording and plotting the titration curve as you proceed. Estimate the pKa's, but note that you may not be able to see all four inflexions.
Using your estimated pKa values for pyrophosphate and the equilibrium constant data from the Table below, use the computer programme "COMICS" to calculate and plot the distribution of copper pyrophosphate species with pH. How does your plot compare with that obtained using the published data?
Table of overall stability constants for P2O74- and ATP4-
   Metal Ion  Equilibrium   (P2O7^4-) Log b, 25C  (ATP^4-) Log b, 25C
  H+    HL/H.L      8.22      6.51
      H2L/H.L2    14.15     10.57
      H3L/H.L3    16.1      -
      H4L/H.L4    16.9      -
  Mg2+    ML/M.L      5.42      5.37
      ML2/M.L2    7.80      -
      MHL/M.HL    3.06      3.18
      MH2L/M.H2L    -     1.33
  Cu2+    ML/M.L      7.6     6.13
      ML2/M.L2    12.45     -
      MHL/M.HL    14.30     3.2
      MH2L/M.H2L    17.61     -
      MHL2/ML2.H    20.41     -
      MH2L2/MHL2.H    26.19     -
      MH3L2/MH2L2.H   30.59     -
      MH4L2/M.H3L2.H    33.80     -
Cu2+ + P2O7 4-
 1 1 12
 1 0 -1 8.22
 1 0 -2 14.15
 1 0 -3 16.1
 1 0 -4 16.9
 1 1  0 7.6
 1 1 -1 12.1
 1 1 -2 14.1
 2 1  0 12.45
 2 1 -1 17.35
 2 1 -2 22.05
 2 1 -3 25.75
 2 1 -4 28.45
 0.1
 0.04
The first line contains a title, the second contains the no. of ligands and metals and total no. of different species. The next series of lines give the Log of the overall stability constants, b, for the formation of the different species. In each case, L= P2O74- and the reactions are written in the form:
L + M + OH- -> MLOH
For example, species 12 is recorded as 2 1 -4 which represents
the formation of the complex with 2 ligands, 1 metal, 4 H+ and
has a stability constant of Log b =28.45.
Note that -1 OH- is the method of representing an H+.
Finally, the last two lines gives the concentration of the ligand and the concentration of the metal ion.
Use the pK values obtained from your titration of the free ligand, to replace the corresponding values from the first four species given above which contain no metal ions. The formation constants are written in the form:
  L + H+    ->  HL    LogK=8.22
  L + 2H+   ->  H2L     LogK=8.22+5.93=14.15 etc.
  so that the first value actually represents the last pKa.
Copyright © 2004 by Robert John Lancashire, all rights reserved.
Created and maintained by Prof. Robert J. Lancashire,