Experiment 5. Construction of a Titration
Curve.
Theory
The range of pH values encountered in aqueous solution is from
about -0.5 to about 14. Since the scale is exponential, a
decrease in pH of 1 unit, in effect is a tenfold increase in
hydronium ion molarity. It is therefore very useful for
monitoring a neutralisation reaction. The measurement of pH is
simplified by the use of a pH meter which relies on the
development of a potential difference between the two electrodes,
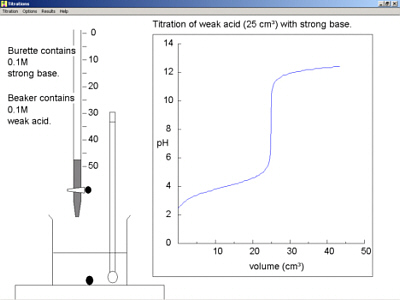
one of which is sensitive to hydronium ions. In this experiment,
the titration curve for a neutralisation reaction will be drawn
and the curve will be interpreted on the basis of ionic theory.
 |
Solution in Burette(X) |
Solution in Beaker (Y) |
| 1. H2SO4 (~ 0.14 M) |
NH4OH (~ 0.1 M) |
| 2. CH3COOH (~ 0.3 M) |
NaOH (~ 0.1 M) |
| 3. NaOH (~ 0.3 M) |
H3PO4 (~ 0.03 M) |
| 4. HCOOH (~ 0.3 M) |
NH4OH (~ 0.1 M) |
| 5. HCl (~ 0.3 M) |
K2CO3 (~ 0.05 M) |
| 6. H2SO4 (~ 0.15 M) |
Na2B4O7 (~0.05 M) |
Method
Switch on the pH meter and allow it to warm up for about five (5)
minutes. Rinse the electrode well with distilled water and allow
to drain, checking that the temperature dial of the instrument is
set at room temperature. Into the beaker provided, place some of
the pH 7 buffer (sufficient to cover the electrode) and adjust
the meter control until it reads the correct pH. Finally, rinse
the electrode assembly and allow it to stand in distilled water.
Fill the burette with reagent X and pipette 25 cm3 of
reagent Y into the reaction beaker (100 cm3) containing the pH
electrode. Read the pH and then add the solution from the burette
1 cm3 at a time, mixing well. Check the meter with the pH 7
buffer at regular intervals.
Record the pH until further addition of reagent produces only
regular small changes in pH (the solution combinations have been
chosen to require no more than 10 cm3 of reagent in the burette
for completion of the curve).
Roughly plot out the curve of volume of reagent added against pH
(pH should be the vertical scale) and examine it to find regions
of the curve which exhibit a large slope. You should plot the pH
after each addition from the burette. Remeasure the pH/volume
curve more accurately over these regions by adding the solution
in the burette in much smaller portions (i.e. in increments of
0.10 or 0.20 cm3 ) until you are quite certain of the pH and
volume of added reagent at all points of inflexion.
Carefully redraw the complete curve, showing on your
graph:
(a) Correctly labelled axes
(b) The solution in the burette and beaker
(c) The pH and volume of added reagent at any inflexion
point(s).
Questions
1. What information can you obtain about the chemical reaction
taking place?
2. If you knew the concentration of the solution in the burette,
would it be possible to determine the concentration of the
reagent in the beaker from your pH curve?
If it is possible, determine the approximate concentration using
the data given for the solutions you used. If the answer to
question 2 is yes, could you use an acid-base indicator instead?
Which one or ones could you use?
 Return to Chemistry, UWI-Mona,
Home Page
Return to Chemistry, UWI-Mona,
Home Page
Copyright © 2002-2009 by The Department
of Chemistry UWI, Jamaica, all rights reserved.
Created and maintained by Prof. Robert J.
Lancashire,
The Department of Chemistry, University of the West Indies,
Mona Campus, Kingston 7, Jamaica.
Created Oct 2002. Links checked and/or last
modified 19th October 2009.
URL
http://wwwchem.uwimona.edu.jm/lab_manuals/c10expt5.html