Experiment 10 Preparation of the benzoate of
phenol.
Theory
Many phenols yield crystalline benzoyl derivatives with benzoyl
chloride in the presence of sodium hydroxide
(Schötten-Baumann method).
Mechanism
Procedure:
To the phenol (0.5 g) is added 5% sodium hydroxide (10 mL) in a
well-corked boiling tube or a small conical flask.
Benzoyl chloride (2 mL, density 1.21 g cm-3) is added in small
quantities at a time, and the mixture shaken vigorously with
occasional cooling under the tap or in ice water.
After 15 minutes the solid benzoate separates out: the solution should be
alkaline at the end of the reaction; if not alkaline, or
if oily, add a solid pellet of sodium hydroxide and shake
again.
Collect the benzoate, wash thoroughly with cold water, and
recrystallise from ethanol (NO FLAMES!). Carry out the tests for
phenols and esters (p 57).
In your lab book record and explain the differences in the IR spectra of
the starting material and product.
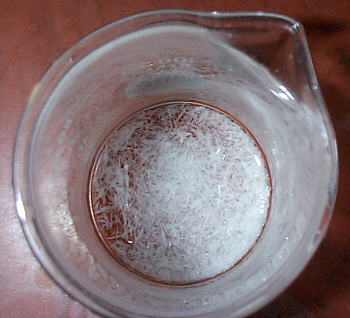
A sample of product prepared in the C10J laboratory
CAUTION:
Benzoyl chloride is LACHRYMATORY and should be handled
with care under a FUME HOOD.
Phenol is not only toxic but will cause severe
burns. USE OF THIN LAYER CHROMATOGRAPHY (TLC) AS AN ANALYTICAL
TECHNIQUE
Objective:
To show how TLC may be used to assess the purity of acompound and
to determine the components present in amixture.
Introduction:
The term chromatography describes a technique whereby substances
may be separated from one another when they are partitioned
between two phases, a mobile phase and a stationary phase.
Suppose a mixture of two compounds A and B are placed, for
example, on a column of silica (the stationary phase) and that B
is more strongly adsorbed than A. If a liquid (the mobile phase,
in which both compounds are soluble) is now passed over the
stationary phase both A and B will tend to be removed from the
silica and be carried along in the direction of liquid flow.
Since B is more strongly adsorbed than A on the silica, it is
less easily removed by the liquid. If the latter is collected in
fractions, it will be observed that the first fraction will
contain compound A only and the latter fractions will contain
compound B. The original mixture is thus separated into its
individual components.
The above separation technique was first applied to the
separation of coloured compounds, e.g. the separation of pigments
in plant material, but it is now widely used for both coloured
and non-coloured materials. The following types of
chromatographic separation are routinely employed in chemical
laboratories:
1. Column
2. Paper
3. Thin layer
4. Gas-solid and
gas-liquid chromatography.
In thin layer chromatography, the stationary phase (e.g. silica,
alumina, cellulose) is deposited as a thin layer (0.1 - 2 mm
thick) on a flat supporting surface, normally a piece of glass of
suitable dimensions (e.g. 5 cm x 20 cm x 0.5 cm). The adsorbent
is generally held in place with a binding agent such as starch or
plaster of Paris. The mixture to be separated is first dissolved
in a suitable solvent then applied (by means of capillary) as a
small spot on the stationary phase a short distance from one end.
The plate is then placed vertically in a developing chamber
containing a small amount of a suitable solvent which serves as
the mobile phase. The latter should be sufficient to cover the
lower edge of the plate but the liquid surface must be below the
applied spot. The chamber is closed and the solvent is allowed to
ascend the layer by capillary action until it is a short distance
from the upper edge of the plate. The latter is then removed from
the chamber and the height of the solvent front noted. If the
experimental conditions are carefully selected, the components in
the mixture will be resolved as separate spots. If the components
are coloured compounds they may be seen directly, or if
colourless, they may be made visible by exposure to iodine vapour
or by viewing the plate under ultraviolet light (if the layer
contains a fluorescent indicator).
The behaviour of a particular component in a specific
chromatographic system is frequently described by its
Rf value. This is derived by means of the equation:
Rf = (distance travelled by compound) / (distance
travelled by solvent)
Procedure:
Dissolve a microspatula load of the phenol provided in the
minimum amount of ethanol. Use a capillary to place a spot (not
more than 3 mm in diameter) on the left side of the TLC plate
about 0.5 cm from the bottom (Note 1). Allow the spot to dry in
air. Repeat with your ester, placing the spot on the right side
of the plate. You now have two spots in the same plate. Measure
approximately 10 mL of 15 parts toluene to one part acetone (v/v)
mixture to use as the developing solvent (the mobile phase) and
transfer it to a clean, dry 250 mL beaker. The liquid level
should be no higher than 0.5 cm. Place the TLC plate vertically
in the beaker and cover it with a watch glass. Allow the solvent
to rise within 1 cm of the top edge of the plate, keeping the
beaker covered. Remove the plate from the beaker, and allow it to
dry in air after marking the position of the solvent front (Note
2). Observe the plate under an ultraviolet lamp and mark with a
pencil the position of any visible spots. Record the number of
components present in each sample and obtain the Rf
value for each component. On your worksheet is an area for you
to draw the TLC plate with the spots observed. Hand in the TLC
plate with your lab worksheet.
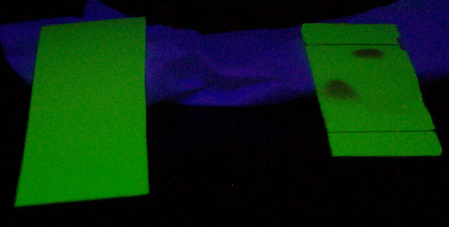
The TLC plate on the left is blank, the plate on the right shows
the phenol band on the left and the ester on the right.
The blue in the background is from a piece of tissue paper. Why
is it blue?
Note 1: If the
spot applied is too large, it becomes diffuse as it is carried
along by the liquid phase and the components may not be resolved
satisfactorily.
Note 2: Discard
eluant in waste bottle provided and not down the sink.
Created and maintained by Prof. Robert J.
Lancashire,
The Department of Chemistry, University of the West Indies,
Mona Campus, Kingston 7, Jamaica.
Created Nov 2002. Links checked and/or last
modified 19th October 2009.
URL
http://wwwchem.uwimona.edu.jm/lab_manuals/c10expt10.html
 Return to Chemistry, UWI-Mona,
Home Page
Return to Chemistry, UWI-Mona,
Home Page