Chloromethanes A number of interpreted IR spectra are available for interactive JSmol display
Simulation of spectra using Gaussian (WebMO.net)
IR CH2Cl2 ---- R-- CH2Cl2 ---- overlay the two --- split overlay
IR CHCl3 ---- R-- CHCl3 ---- overlay the two --- split overlay
IR of Liquid samples CH2Cl2 ---- CD2Cl2 ---- overlay the two --- split overlay
CHCl3 ---- CDCl3 ---- overlay the two --- split overlay

Toggle Grid Toggle Coordinates Reverse plot


The spectra are "hot-linked" to the molecular graphic display such that selecting a peak in the IR spectrum will cause a vibrational mode animation to be displayed.

The first exercise is to examine the applications of symmetry and group theory in the elucidation of the vibrational (Infrared and Raman) spectra of compounds. Several sample molecules and provided and you should calculate the number of Infrared and Raman active vibrations and compare their results with the experimental data given.

The CH2Cl2 and CD2Cl2 belong to the C2v point group while CHCl3 and CDCl3 belong to the C3v point group.

Character table for C2v point group
E C2 (z) σv(xz) σv(yz) linear,
rotations
quadratic
A1 1 1 1 1 z x2, y2, z2
A2 1 1 -1 -1 Rz xy
B1 1 -1 1 -1 x, Ry xz
B2 1 -1 -1 1 y, Rx yz
     Character table for C3v point group
E 2C3 (z) v linear,
rotations
quadratic
A1 1 1 1 z x2+y2, z2
A2 1 1 -1 Rz
E 2 -1 0 (x, y) (Rx, Ry) (x2-y2, xy) (xz, yz)

As an additional exercise it is possible to use the concept of Hooke's Law and reduced mass to predict the frequency of the C-D stretch based on the C-H stretch.

To identify the observed differences between the H and D (deuterated) spectra of various chloromethanes and calculate the expected frequency changes based on the change of mass.

The equation:
Hookes Law for springs
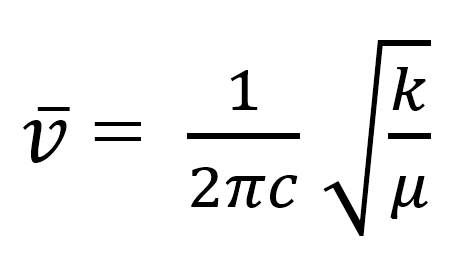
is derived from Hooke's law, where ν is in wavenumbers, k = the force constant,
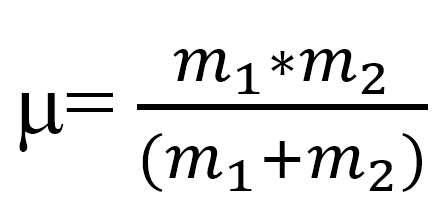
and μ is the reduced mass of the system:
equation for reduced mass

To get things started, the band at 3019.5 cm-1 in the chloroform spectrum is the result of C-H bond stretching and the equivalent C-D stretching frequency can be estimated by taking the ratio of the frequencies whereby most of the other variables cancel leaving just the reduced masses.

Acknowledgements
The simulated spectra were obtained using the WebMO interface to Gaussian. IR and Raman spectra were exported as uncompressed JCAMP-DX files and on-line computing times were less than 10 seconds for each isomer.

Copyright © 2019 by The Department of Chemistry, UWI, Jamaica, all rights reserved.

Created and maintained by Prof. Robert J. Lancashire,
The Department of Chemistry, University of the West Indies,
Mona Campus, Kingston 7, Jamaica.

Created February 2012. Links checked and/or last modified 23rd February 2019.
URL http://wwwchem.uwimona.edu.jm/spectra/jsmol/demos/ClMethanes.html