Chemistry and crime

GC-MS
Gas chromatography-mass spectrometry (GC-MS) is a method that combines the features of gas chromatography and mass spectrometry to identify different substances within a test sample. Applications of GC-MS include drug detection, fire investigation, environmental analysis, explosives investigation, and identification of unknown samples. GC-MS can be used in airport security to detect substances in luggage or on human beings. Additionally, it can identify trace elements in materials that were previously thought to have disintegrated beyond identification.

A GC-MS has two major components: the gas chromatograph and the mass spectrometer (acting as the detector). The gas chromatograph utilizes a capillary column and the level of separation is dependent on the column's dimensions (length, diameter, film thickness) as well as the phase properties (e.g. 5% phenylpolysiloxane). The differences in the chemical properties of the molecules in a mixture will cause them to separate as they travel the length of the column. The molecules take different amounts of time (called the retention time) to exit the column (elute from) the gas chromatograph, and this allows the mass spectrometer downstream to capture, ionize, accelerate, deflect, and detect the ionized molecules separately. The mass spectrometer does this by breaking each molecule into ionized fragments and detecting these fragments by their mass to charge ratio.

schematic of GCMS MS of testosterone
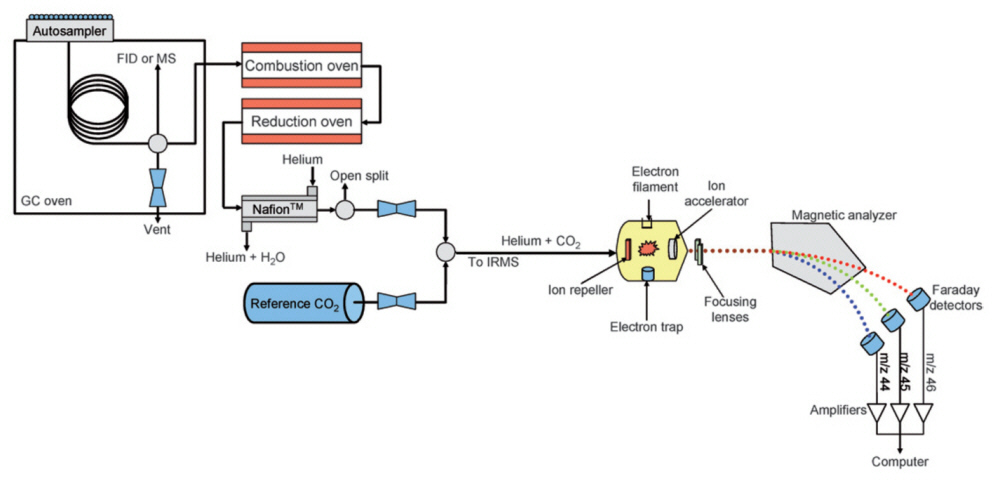
Schematic of a GCMS and the MS of testosterone

A common method of analysis measures the peaks in relation to one another. In this method, the tallest peak is assigned a value of 100% and the other peaks are assigned values in proportion to this. All values above 3% are assigned. The total mass of the unknown compound is normally indicated by the parent peak. The value of this parent peak can be used to fit with a chemical formula containing the various elements which are believed to be in the compound. The isotope pattern in the spectrum, which is unique for elements that have many isotopes, can be used to identify the various elements present. Once a chemical formula has been matched to the spectrum, the molecular structure and bonding can be identified, and must be consistent with the characteristics recorded by GC-MS. Typically, this identification is automatically done by software that comes with the instrument, given a list of the elements that could be present in the sample.

A "full spectrum" analysis considers all the "peaks" within a spectrum. Conversely, selective ion monitoring (SIM) only monitors selected peaks associated with a specific substance. This is done on the assumption that at a given retention time, a set of ions is characteristic of a certain compound. This is a fast and efficient analysis, especially if the analyst has previous information about a sample or is only looking for a few specific substances. Some early libraries were built up based on just the 16 most significant fragments to give a breakdown pattern that could still provide good accuracy of identification.

Detection of anabolic steroids in athletes.
In addition to having to detect a broad range of compounds, it is often necessary to determine substances that are have only a transient existence in the body - in some cases, a matter of hours. Even if a test were given within that time, the identification of performance-enhancing agents, like testosterone or EPO is made more complicated given that the body may naturally produce these compounds, albeit at lower levels. Furthermore, because the normal concentrations of these compounds in urine or blood can vary from athlete to athlete, it is necessary to devise appropriate strategies for identifying the true source of the performance-enhancing agent.

Often, just detecting a banned substance is not enough. For a positive test to withstand an athlete's legal challenge, IOC chemists must develop secondary, more accurate tests that confirm the drug's presence.

For some time the primary method of IOC testing laboratories has been GC/MS. At the Unité d'Analyse du Dopage, an IOC-accredited lab in Lausanne (Switzerland), GC/MS is used in six of the seven standard tests for dopant detection. Identifying and confirming an illegal substance is sufficient in most GC/MS procedures; quantification is only required for naturally occurring substances and other drugs that must fall within defined concentration limits such as caffeine.

The most commonly employed human physiological specimen for detecting anabolic steroid usage is urine, although both blood and hair have been investigated for this purpose. The anabolic steroids, whether of endogenous or exogenous origin, are subject to extensive hepatic biotransformation by a variety of enzymatic pathways. The primary urinary metabolites may be detectable for up to 30 days after the last use, depending on the specific agent, dose and route of administration. A number of the drugs have common metabolic pathways, and their excretion profiles may overlap those of the endogenous steroids, making interpretation of testing results a very significant challenge to the analytical chemist. Methods for detection of the substances or their excretion products in urine specimens usually involve gas chromatography-mass spectrometry or liquid chromatography-mass spectrometry.

Cocaine in Hair
MS of cocaine in hair
Use of MS for detection of cocaine in hair

Qualitative and quantitative data were acquired to confirm the cocaine intake by monitoring a length of hair every 1mm. This was done by using MS to confirm the drug identity with a relative quantitation from the scalp to the tip and a simultaneous determination of the benzoylecgonine (i.e. a cocaine metabolite) to cocaine ratio (BZE/COC) which must be greater than 0.05 to prevent false positive results due to external contamination.

The method allowed monitoring the consumption from chronic users with a sensitivity of 5 ng mg-1. The range usually found in hair for cocaine users is 0.5 - 200 ng mg-1.

GC-IRMS is a specialization of mass spectrometry, in which mass spectrometric methods are used to measure the relative abundance of isotopes in a given sample. A good practice Forensic guide is available.

Natural abundance of the isotopes and the Commission on Isotopic Abundances and Atomic Weights
In chemistry, the atomic weight for each element is provided in the Periodic Table. The atomic weight of an element is calculated from the sum of the products of the atomic mass and the isotopic abundance of each stable isotope of that element. The Standard Atomic Weight is the recommended value that can apply to all samples of a given element. Consider the simplified calculation for the case of carbon (all of whose isotopes have 6 protons since its atomic number is 6). Carbon has 2 stable isotopes of mass number 12 (abbreviated as 12C; corresponding to an atom with 6 protons and 6 neutrons) and mass number 13 (13C; corresponding to an atom with 6 protons and 7 neutrons). The atomic mass of each isotope can be approximated by its mass number, 12C ~ 12 and 13C ~ 13. Natural carbon is a mixture of 12C and 13C atoms with approximate isotopic abundances of 99% and 1%, respectively. The approximate atomic weight for this sample of carbon would be 12 x 0.99 + 13 x 0.01 = 12.01.

IUPAC display of isotopes
Latest method from IUPAC for displaying isotopic information

The stable isotopic abundances are shown as pie diagrams (from left to right):
Element (chlorine) whose standard atomic weight is not a constant of nature is presented as an interval within square brackets based on an assessment of the lower and upper bounds.
Element (mercury) whose standard atomic weight is not a constant of nature and whose standard atomic weight has not yet been assesed is not given as an interval.
Element (arsenic) whose standard atomic weight is a constant of nature because it has only one stable isotope.
Element (americium) has no stable isotopes and thus no standard atomic weight.

For any element that has two or more stable isotopes, there is always the possibility that the relative amounts of stable isotopes may vary in different samples of that element found in nature. The ratio of isotopes may therefore vary slightly as a result of isotopic fractionation during physical, chemical and biological processes. Using the above example, let us assume that another sample of carbon is made up of 98% 12C and 2% 13C. That sample of carbon would have an approximate atomic weight of 12 x 0.98 + 13 x 0.02 = 12.02. Thus, natural isotopic variation for an element can have an effect on the element's atomic weight value. For 10 such elements, the Standard Atomic Weight assigned by IUPAC is given with lower and upper bounds (called an interval) written in brackets (e.g., for chlorine, it is [35.446; 35.457]). These elements are indicated in pink on the Table. Those elements for which no such assessments have yet been made or completed are indicated in yellow and their Standard Atomic Weights are given with an uncertainty in parentheses [e.g., for mercury, 200.59(2) which is a contracted notation of 200.59 +/- 0.02].

The full isotopic table is available as a PDF for download from the Commission on Isotopic Abundances and Atomic Weights (CIAAW)

The elements that are routinely measured with gas inlet mass spectrometers include carbon (13C and 12C, but not 14C), oxygen (18O, 17O and 16O), hydrogen (2H and 1H, but not 3H), nitrogen (15N and 14N) and sulfur (36S, 34S, 33S and 32S).

Measuring the absolute abundance of a particular isotope is not a simple task and requires sophisticated instrumentation. Likewise, measuring the absolute isotopic ratio of various species like 13C / 12C cannot be performed on a routine basis without leading to problems when comparing data sets from different laboratories. Fortunately, it is possible to compare the variations in stable isotope concentrations rather than actual abundance and so rather than measuring a true ratio, an apparent ratio can be measured by gas source mass spectrometry. The apparent ratio differs from the true ratio due to operational variations (e.g. machine error) and will not be constant between machines or laboratories, or even on different days for the same machine. However, by measuring a known reference on the same machine at the same time, it is possible to compare the sample with the reference.

Isotopic concentrations are thus expressed as the difference between the measured ratios of the sample and reference -1. Mathematically, the error between the apparent and true ratios should then cancel out and can be ignored. This is expressed using the delta notation (with Carbon shown as an example). Since fractionation at the natural abundance levels is usually small, δ values are expressed in parts per thousand or "per mil" (‰) difference from the reference.
delta notation
δ notation for isotope ratio sampling

Rstandard = 0.0112372 for PDB (but assigned value of 0 ‰)
Vienna-PeeDee belemnite standard (VPDB)

The Carbon isotope signature.
The common reference for δ 13C Marine Carbonate Standard was obtained from a Cretaceous marine fossil, Belemnitella americana, from the PeeDee Formation in South Carolina. This material has a higher 13C/12C ratio than nearly all other natural carbon-based substances. For convenience it is assigned a δ13C value of zero, giving almost all other naturally-occurring samples a positive δ value.

The original sample was used up long ago, but a Vienna-based laboratory calibrated a new reference sample to the original fossil, giving rise to the widespread use of the term Vienna-PeeDee Belemnite standard, abbreviated to V-PDB.

Stable carbon isotopes in carbon dioxide are utilized differentially by plants during photosynthesis. Grasses in temperate environments (barley, rice, wheat, rye and oats, plus sunflower, potato, tomatoes, peanuts, cotton, sugar beet, and most trees and their nuts/fruits, roses and Kentucky bluegrass) follow a C3 photosynthetic pathway (CO2 + ribulose bisphosphate (RuBP) → 3-phosphoglycerate) that will yield δ13C values averaging about -26.5‰. Grasses in hot arid environments (maize in particular, but also millet, sorghum, sugar cane and crabgrass) follow a C4 photosynthetic pathway (phosphoenolpyruvate (PEP) + CO2 → oxaloacetate) that produces δ13C values averaging about -12.5‰.

It follows that eating these different plants will affect the δ13C values in the consumer's body tissues. If an animal (or human) eats only C3 plants, the δ13C values have been found to be -12.5‰ in their bone collagen and -14.5‰ in their apatite.

In contrast, C4 feeders are found to have bone collagen with a value of -7.5‰ and apatite value of -0.5‰.

13C/12C ratio variation
Variation of δ13C (‰ vs V-PDB)
adapted from J Mass Spec., 31, 225, (1996)

In actual case studies, millet and maize eaters were easily distinguished from rice and wheat eaters. Studying how these dietary preferences are distributed geographically through time can illuminate migration paths of people and dispersal paths of different agricultural crops. However, human groups have often mixed C3 and C4 plants (northern Chinese historically subsisted on wheat and millet), or mixed plant and animal groups together (for example, southeastern Chinese subsisting on rice and fish).

Other relevant standards include SMOW ('Standard Mean Ocean Water') for oxygen and hydrogen, air for N, (atmospheric N, is very uniform in space and time) and CDT (Canyon Diablo troilite, meteoritic S) for sulfur. All these standards have been assigned a value of 0.0‰ on their respective δ scales.

The Nitrogen isotope signature.
Natural Nitrogen (N) consists of two stable isotopes, 14N, which makes up the vast majority of naturally occurring nitrogen, and 15N. The ratio of 15N/14N presents a characteristic distinction between herbivores and carnivores, as the movement up along the food chain tends to concentrate the 15N isotope, by 3-4‰ with each step of the food chain (terrestrial plants, with the exception of legumes, have an isotopic ratio of 2-6‰ of N). The tissues and hair of vegans therefore contain significantly lower percentage of 15N than the bodies of people who eat mostly meat. Isotopic analysis of hair is an important source of information for archaeologists, providing clues about the ancient diets; a terrestrial diet produces a different signature than a marine-based diet and this phenomenon has been used in analysing differing cultural attitudes to food sources.

The Oxygen isotope signature
Naturally occurring oxygen is composed of three stable isotopes, 16O, 17O, and 18O, with 16O being the most abundant (99.762% natural abundance). Known oxygen isotopes range in mass number from 12 to 24.

Why do we expect the ratios to vary?
Basic Principles: fractionation
Since the various isotopes of an element have different mass, their chemical and physical properties are expected to be slightly different. The isotopes of the lighter elements have mass differences that are large enough for many physical, chemical, and biological processes or reactions to "fractionate" or change the relative proportions of various isotopes. Two different types of processes - equilibrium and kinetic isotope effects - cause isotope fractionation. This fractionation may be indicative of the source of substances involved, or of the processes through which such substances went through. Equilibrium isotope-exchange reactions involve the redistribution of isotopes of an element among various species or compounds. At equilibrium, the forward and backward reaction rates of any particular isotope are identical. Equilibrium isotope effects derive from the effect of atomic mass on bond energy. The bond energy consumed by molecules incorporating the heavy isotope is higher than bond energy of molecules formed by the light isotope. Bonds involving the light isotope are weaker, and therefore easier to break. Molecules incorporating the light isotopes are thus "more reactive" than molecules of the same substance, but formed by a higher proportion of the corresponding heavy isotope.

Isotopic rate changes are most pronounced when the relative mass change is greatest, since the effect is related to vibrational frequencies of the affected bonds. For instance, changing a hydrogen atom to deuterium represents a 100% increase in mass, whereas in replacing carbon-12 with carbon-13, the mass increases by only 8%. The rate of a reaction involving a C-H bond is typically 6 to 10 times faster than the corresponding C-D bond, whereas a 12C reaction is only ~1.04 times faster than the corresponding 13C reaction (even though, in both cases, the isotope is one atomic mass unit heavier).

Kinetic isotope fractionations occur in systems out of isotopic equilibrium where forward and backward reaction rates are not identical. The reactions may, in fact, be unidirectional if the reaction products become physically isolated from the reactants. Reaction rates depend on the ratios of the masses of the isotopes and their vibrational energies; as a general rule, bonds between the lighter isotopes are broken more easily than the stronger bonds between the heavy isotopes. Hence, the lighter isotopes react more readily and become concentrated in the products, and the residual reactants become enriched in the heavy isotopes.

Biological processes are generally unidirectional and are excellent examples of "kinetic" isotope reactions. Organisms preferentially use the lighter isotopic species because of the lower energy "costs", resulting in significant fractionations between the substrate (heavier) and the biologically mediated product (lighter).

GC/C/IRMS
Gas chromatography combustion isotope ratio mass spectrometry (GC/C/IRMS) is a highly specialised instrumental technique used to ascertain the relative ratio of light stable isotopes of carbon (13C/12C), hydrogen (2H/1H), nitrogen (15N/14N) or oxygen (18O/16O) in individual compounds separated from often complex mixtures of components. The primary prerequisite for GC/C/IRMS is that the compounds constituting the sample mixture are amenable to GC, i.e. they are suitably volatile and thermally stable. Polar compounds may require further chemical modification (derivatization) and in such cases the relative stable isotope ratio of the derivatization agent must also be determined.

The schematic diagram below is of a typical GC/C/IRMS instrument. As is the case for GC/MS, the sample solution is injected into the GC inlet where it is vapourized and swept onto a chromatographic column by the carrier gas (usually helium). The sample flows through the column and the compounds comprising the mixture of interest are separated by virtue of their relative interaction with the coating of the column (stationary phase) and the carrier gas (mobile phase). For the detection of carbon and nitrogen, compounds eluting from the chromatographic column then pass through a combustion reactor (an alumina tube containing Cu, Ni and Pt wires maintained at 940 °C) where they are oxidatively combusted. This is followed by a reduction reactor (an alumina tube containing three Cu wires maintained at 600 °C) to reduce any nitrogen oxides to nitrogen. For hydrogen and oxygen detection a high temperature thermal conversion reactor is required (not shown). Water is then removed in a water separator by passing the gas stream through a tube constructed from a water permeable nafion membrane. (Nafion is a sulfonated tetrafluoroethylene based fluoropolymer-copolymer). The sample is then introduced into the ion source of the MS by an open split interface.

GC-IRMS
Schematic of a GC-IRMS for monitoring CO2 (at m/z 44, 45 and 46).

See as well the notes on GC-IRMS at Bristol University for additional information.

Ionisation of the analyte gases (CO2, H2, N2 or CO) may be achieved using electron ionisation (EI). The ionised gases are separated in a single magnetic sector analyser by virtue of their momentum and are detected by an array of Faraday cups the output from which is used to calculate the final stable isotope ratio. This is calculated relative to a standard of known isotopic composition and expressed using the dimensionless 'per mil' notation.

Some applications of GC-IRMS

Archaeology/geosciences
Geochemistry and geology
Palaeoclimatology
Palaeoecology

Forensic sciences
Determining whether samples of chemically similar substances such as drugs, explosives, fibres, paints, inks, tapes or adhesives may share a common source or history
Distinguishing counterfeit products (e.g. pharmaceuticals) from genuine materials
Comparing putative reactants with contraband products
Environmental forensics and monitoring
Wildlife forensics.
Food authenticity and traceability
Biological sciences
Ecology
Human and plant physiology
Human provenancing
Toxicology

Drugs of Abuse and Pharmaceuticals
In the fight against the trafficking of drugs, an extremely useful piece of information for the Authorities is to be able to determine both the area of production and the possible routes followed by dealers. When a batch of heroin, cocaine or other drugs is seized, the drug itself and the impurities it contains may provide a record of its origins and its distribution circuit. Drugs such as heroin or cocaine are derived from plant materials. The photosynthetic pathway of the plant (C3 vs C4), the soil nitrogen the plant had available for growth, and environmental factors, such as climate and water availability, all impart a specific isotope signature to the final product. If adulterants were used to "cut" the drug this may affect the ratios as well so that the end result is that every batch is individualised on its combined δ values for Carbon, Nitrogen and Hydrogen when used in combination.

An example of this is the case of marijuana. In a 2009 report,
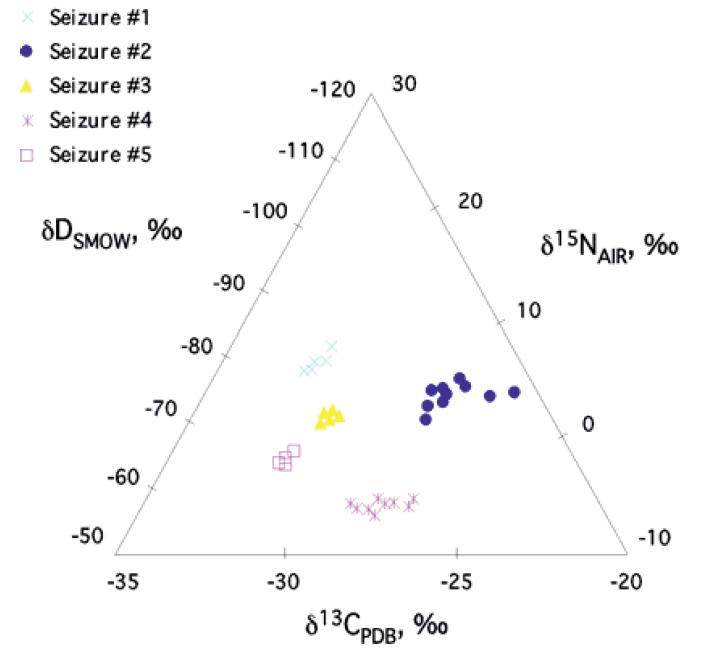
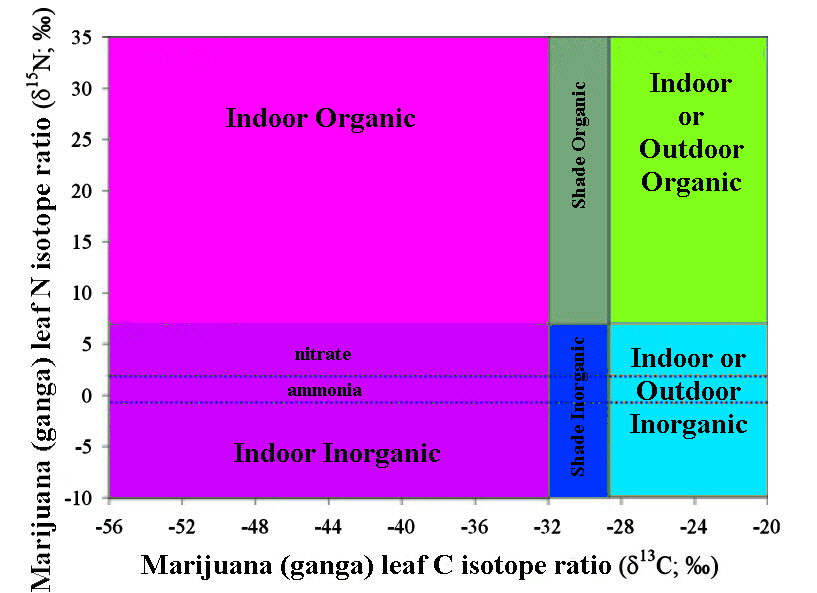
the δ13C and δ15N of 508 domestic samples of marijuana were analyzed from known U.S.A. counties, 31 seized from a single location, 5 samples grown in Mexico and Colombia, and 10 northwest border seizures. For a given subset, inflorescences and leaves were separately analyzed. These data revealed a strong correspondence, with inflorescences having slightly higher δ13C and δ15N values than leaves. A framework for interpreting the results was introduced and evaluated. Samples identified as outdoor-grown by δ13C were generally recorded as such by the Drug Enforcement Administration (DEA). DEA-classified indoor-grown samples had the most negative δ13C values, consistent with indoor cultivation, although many were also in the outdoor-grown domain. δ15N indicated a wide range of fertilizers across the dataset. Samples seized at the single location suggested multiple sources. Northwest border δ13C values suggested indoor growth, whereas for the Mexican and Colombian samples they indicated outdoor growth.
IRMS study of ganga
Variation of C and N isotope ratios depending on whether the marijuana (ganga) was grown indoor or outdoor and used organic or inorganic fertiliser.

The 13C content in the samples analyzed decreases from rural areas to metropolitan areas to plants grown indoors. This order coincides with the order of the 13C content in the ambient air under which these plants are grown. In greenhouses, where a heater using natural gas containing less-than-usual amounts of 13C is used, the carbon dioxide levels would be the lightest. The reabsorption of carbon dioxide derived from plants confined in the greenhouse might have led to further depletion in 13C content. Due to the heavy use of petroleum products, it seems reasonable to assume that the 13C content in metropolitan areas are less than that of rural areas.

Cocaine
Coca leaves from South America were found to vary in their δ13C and δ15N values. Humidity levels and the length of the rainy season and differences in soils were thought to affect the fixation processes and cause the observed subtle variations in 13C and 15N contents, respectively. In conjunction with the variations of trace alkaloids (truxilline and trimethoxycocaine) contents found in cocaine, researchers were able to correctly identify 96% of 200 cocaine samples originated from the regions studied.

cocaine delta 13C/ 15N variation with location
Regional grouping of cocaine based on δ 13C/ 15N variation.

Ecstasy
Ecstasy (3,4-methylenedioxymethylamphetamine; MDMA) is typically prepared from a number of cheap and readily available natural products, and is classed as a synthetic drug rather than being directly derived from plant extracts.

ecstasy deltas determined from seized samples
Grouping of ectasy δ's determined from seized samples

The results found to date suggest that δ15N is a major discriminating factor, while δD and δ13C are minor factors. The combined use of δ13C and δ15N appears to reflect reductive amination, while δD reflects origin and solvent history.

Testosterone
Synthetic testosterone holds an allure for cheating athletes because it's identical to natural testosterone. MS can detect testosterone in urine, but the spectra of the natural and synthetic hormones look the same. During the 1980s and 1990s, Catlin, who then worked at the UCLA Olympic Analytical Laboratory, and his colleagues figured out a way to distinguish between the two. Synthetic testosterone isn't made from scratch. Pharmaceutical manufacturers perform partial synthesis in which a precursor plant compound, typically from yams, is converted into testosterone in a few steps. The plant compound has a different carbon isotope ratio from human testosterone. Catlin and colleagues developed a test, based on the carbon isotope ratio, that can discern the atomic differences between synthetic and natural testosterone. Because the concentrations of testosterone in urine are very low, in practice investigators look at the carbon isotope ratio of its metabolites. The Olympic Movement Anti-Doping Code acknowledged the test in 1999. The method caught Justin Gatlin, the U.S. sprinter who won gold medals in the 2004 Olympic Games, and it has been used to evaluate accusations of doping against Floyd Landis, the winner of the 2006 Tour de France.

The results of GC/MS analyses for testosterone (T) vs. epiandrosterone (E) (T/E > 4) are of debatable significance and need further confirmation. A new method was introduced for detecting testosterone abuse involving IR-GC/MS based on a simple idea. Testosterone is synthesized in the body from cholesterol via dehydroepiandrosterone (DHEA) and is further metabolized to androstanediol. This endogenous pathway in the body always shows a distinctive isotope pattern. According to the investigation there is a small isotope shift of about -2‰ when testosterone is sythesized from plant material. Since commercially available testosterone has a markedly different δ13C value, any intake will destroy the natural pattern.

testosterone delta 13C changes
δ13C changes after administration with synthetic testosterone after day two
Series 1: pregnanediol, Series 2: 5α-androstane-3α,17βdiol, Series 3: 5β-androstane-3α,17βdiol

The tests showed that pregnanediol did not change dramatically following administration of testosterone, while δ13C of the 5α- and 5β-androstane-3α,17βdiols changed by about 2‰ after the administration, and only started to recover after 6-7 days. The pregnanediol could therefore act as an internal reference to relate to diet, or could possibly be used to develop an indication ratio for abuse. Metabolites that are unaffected by testosterone could be used as the individual's baseline, and therefore regulatory values could be agreed upon for future doping tests.

A narrow range of -29.15 to -30.41‰ was found for 5 synthetic testosterone samples manufactured in 5 different countries. A conservative cut-off value of -29.0‰ was suggested for androstanediol to unambiguously identify testosterone abuse for up to 7 days after administration.

Cyanide

http://www.fsijournal.org/article/S0379-0738%2811%2900534-2/abstract

References
GC/MS Drug Testers Face Olympian Challenge
An article by Clemente Recio Hernández on GC-IRMS
Acknowledgements.
Much of the information in these course notes has been sourced from Wikipedia under the Creative Commons License. Students taking this course will be expected to contribute to Wikipedia as a part of their course assignments.
Continue on to Toxicity and Poisons, return to Unit on Crime or the CHEM2402 course outline.

Creative Commons License
This work is licensed under a Creative Commons Attribution-ShareAlike 3.0 Unported License.

Dr Bird logoReturn to Chemistry, UWI-Mona, Home Page
Created and maintained by Prof. Robert J. Lancashire,
The Department of Chemistry, University of the West Indies,
Mona Campus, Kingston 7, Jamaica

Created September 2011. Links checked and/or last modified 15th November 2013.
URL http://wwwchem.uwimona.edu.jm/courses/CHEM2402/Crime/GC_IRMS.html